by Samuel Stebbins
In much of the country, public pension funding has been one of the most persistent public policy problems. For years, many state governments have failed to make necessary investments in their retirement system, resulting in funding gaps that increasingly present a looming reckoning for taxpayers.
According to a recent report published by The Pew Charitable Trusts, a public policy think tank, many states are now taking earnest measures to reduce their pension funding gap. These measures include increased contributions, cost reduction strategies, and more sophisticated pension management tools. States have also benefited from once-in-a-generation investment returns following the COVID-19 market crash in March 2020.
Still, based on 2019 data, the most recent year of available comprehensive data, the majority of states have a funding shortfall of 25% or more.
Georgia’s pension funding gap grew slightly over the year. Currently, the state has $121.6 billion in pension liabilities and $95.6 billion in assets, a 78.7% funding ratio. The year prior, the state had an 80.1% funding ratio.
Still, Georgia is better positioned than most other states. At current levels, without any additional investments, the state’s public retirement system could meet its obligations for another 14 years.
All pension funding data used in this story was compiled by The Pew Charitable Trusts and is for 2019. We also considered public-sector, state-level employment, both in raw numbers and as a share of overall employment, using data from the Bureau of Labor Statistics.
| Rank | State | Pension funding ratio | Pension assets ($, billions) | Pension liabilities ($, billions) | State government employees |
|---|---|---|---|---|---|
| 1 | Wisconsin | 103.0% | 112.1 | 108.9 | 89,800 |
| 2 | South Dakota | 100.1% | 12.5 | 12.5 | 17,300 |
| 3 | Tennessee | 98.2% | 41.1 | 41.8 | 95,500 |
| 4 | Washington | 96.3% | 100.9 | 104.8 | 142,700 |
| 5 | New York | 96.1% | 215.2 | 223.9 | 254,600 |
| 6 | Idaho | 94.6% | 17.7 | 18.8 | 30,100 |
| 7 | Nebraska | 93.1% | 15.2 | 16.3 | 42,500 |
| 8 | Utah | 91.7% | 35.2 | 38.4 | 81,200 |
| 9 | North Carolina | 88.4% | 101.4 | 114.6 | 196,100 |
| 10 | Iowa | 85.4% | 34.8 | 40.7 | 67,100 |
| 11 | Maine | 84.3% | 15.1 | 17.9 | 24,600 |
| 12 | Delaware | 83.4% | 10.2 | 12.2 | 32,200 |
| 13 | West Virginia | 83.4% | 15.9 | 19.1 | 46,900 |
| 14 | Minnesota | 82.2% | 70.8 | 86.1 | 98,900 |
| 15 | Oklahoma | 80.7% | 33.2 | 41.1 | 79,700 |
| 16 | Oregon | 80.2% | 70.2 | 87.5 | 41,300 |
| 17 | Arkansas | 80.0% | 28.6 | 35.7 | 76,200 |
| 18 | Ohio | 80.0% | 168.4 | 210.5 | 168,000 |
| 19 | Georgia | 78.7% | 95.6 | 121.6 | 162,500 |
| 20 | Florida | 78.2% | 163.9 | 209.5 | 246,400 |
| 21 | Missouri | 77.8% | 59.9 | 77.0 | 100,200 |
| 22 | Virginia | 77.2% | 79.8 | 103.3 | 157,300 |
| 23 | Nevada | 76.5% | 44.3 | 57.9 | 40,200 |
| 24 | Wyoming | 76.5% | 9.0 | 11.8 | 13,600 |
| 25 | Montana | 72.5% | 11.9 | 16.4 | 27,400 |
| 26 | California | 71.9% | 474.3 | 659.4 | 521,600 |
| 27 | Maryland | 71.6% | 54.3 | 75.8 | 108,100 |
| 28 | Kansas | 69.9% | 20.6 | 29.5 | 50,700 |
| 29 | North Dakota | 69.8% | 5.9 | 8.4 | 21,400 |
| 30 | Alabama | 69.4% | 38.5 | 55.5 | 117,000 |
| 31 | Texas | 69.0% | 186.8 | 270.7 | 426,400 |
| 32 | Indiana | 68.6% | 30.8 | 44.9 | 108,900 |
| 33 | Alaska | 67.4% | 15.2 | 22.6 | 22,500 |
| 34 | New Mexico | 67.3% | 29.2 | 43.4 | 53,700 |
| 35 | Louisiana | 66.9% | 36.8 | 54.9 | 86,800 |
| 36 | Colorado | 66.5% | 51.8 | 77.9 | 126,600 |
| 37 | New Hampshire | 65.5% | 9.2 | 14.1 | 22,400 |
| 38 | Arizona | 65.2% | 49.9 | 76.6 | 89,800 |
| 39 | Vermont | 63.7% | 4.5 | 7.1 | 17,800 |
| 40 | Mississippi | 61.7% | 28.6 | 46.4 | 57,400 |
| 41 | Michigan | 61.1% | 65.0 | 106.4 | 178,800 |
| 42 | Massachusetts | 59.4% | 58.3 | 98.1 | 122,600 |
| 43 | Pennsylvania | 58.0% | 89.8 | 154.8 | 148,600 |
| 44 | South Carolina | 55.4% | 32.3 | 58.3 | 103,500 |
| 45 | Hawaii | 54.9% | 17.2 | 31.4 | 67,000 |
| 46 | Rhode Island | 54.5% | 6.6 | 12.1 | 20,400 |
| 47 | Kentucky | 44.6% | 24.0 | 53.7 | 90,800 |
| 48 | Connecticut | 44.4% | 32.0 | 72.1 | 71,000 |
| 49 | New Jersey | 39.7% | 82.3 | 207.1 | 138,700 |
| 50 | Illinois | 38.9% | 92.6 | 237.9 | 147,000 |
– – –
Samuel Stebbins is a contributor to The Center Square.
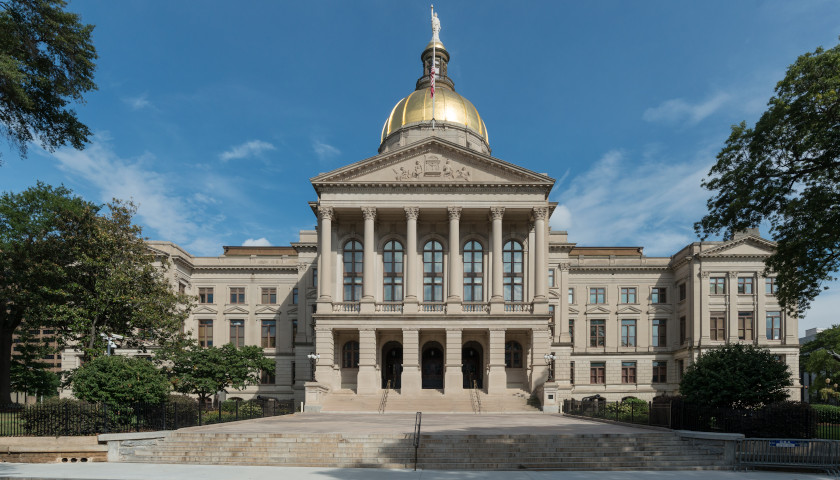
Photo “Georgia Capitol” by Ken Lund. CC BY-SA 2.0.


